...
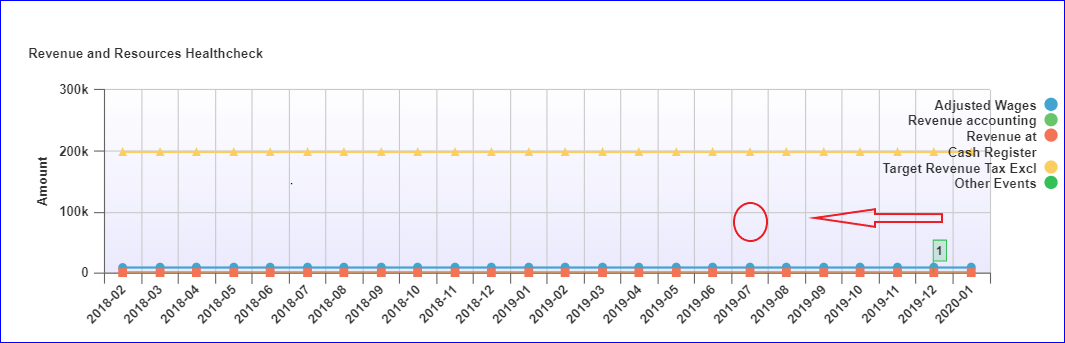
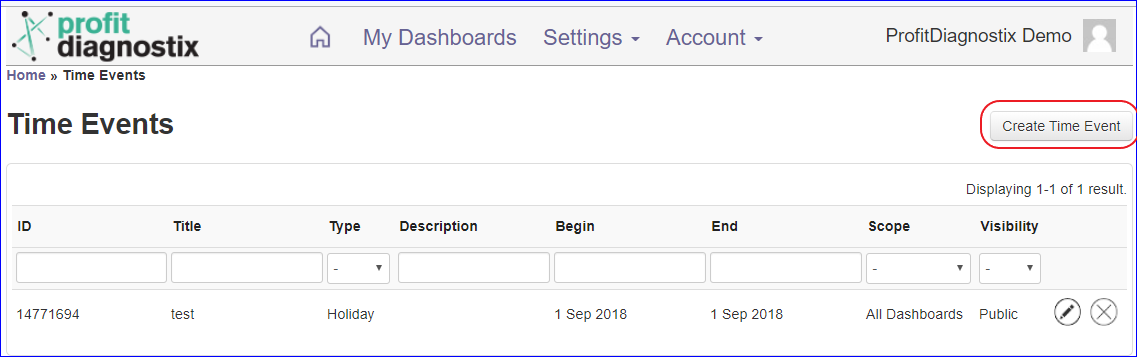
You can create a time event from the settings menu as shown above or by left clicking on a graph at the time where you want to display an event.
When clicking the graph a pop up window will display. The same window displays creating a time event from settings.
If displaying the event in the current graph only and not on all reports use this method. The red circle is where you would click if adding an event for July 2019.
Click on Create a time event if using settings
The pop up window displays as below
Type - Holiday or Other
Title - i.e. Changed Target
Visibility - Public or Private
Marker Type - i.e. Flag
Colour - Choose your own colour
Shown on - All Reports or Select a report. (adding a time event directly from the graph gives the option Current report Only)
Begin - put in dates
Description - add something meaningful to other users
Then Save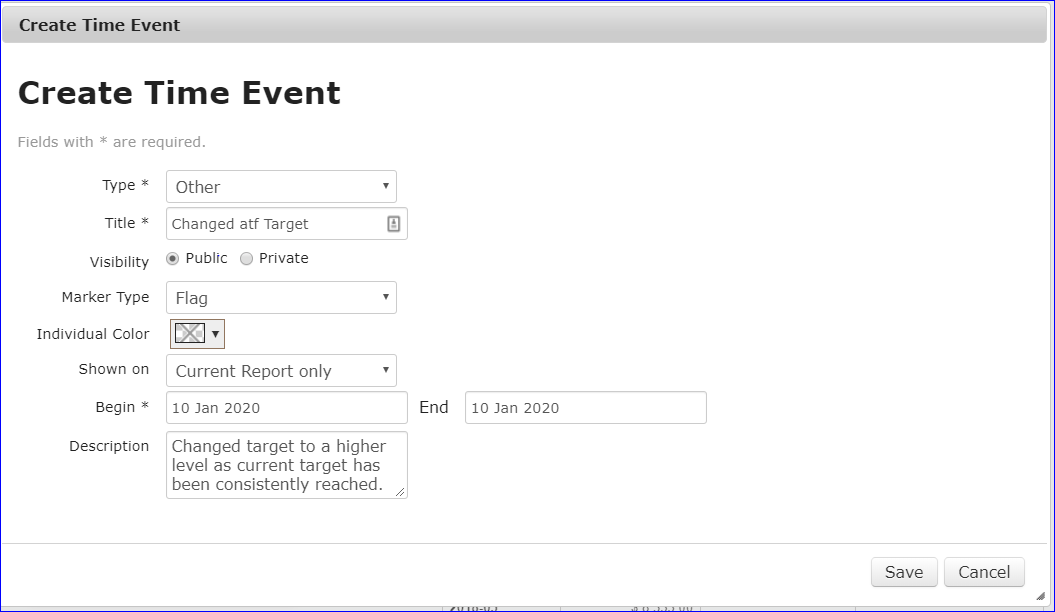
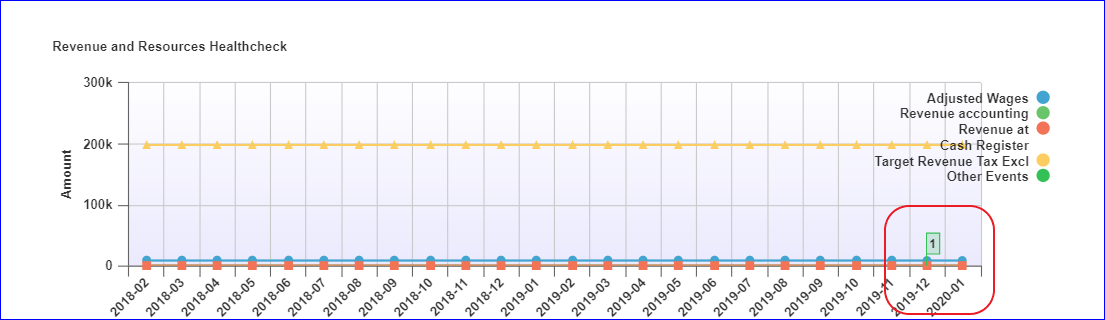
To see the time event hover on the flag.
To read or edit the time event click on the flag
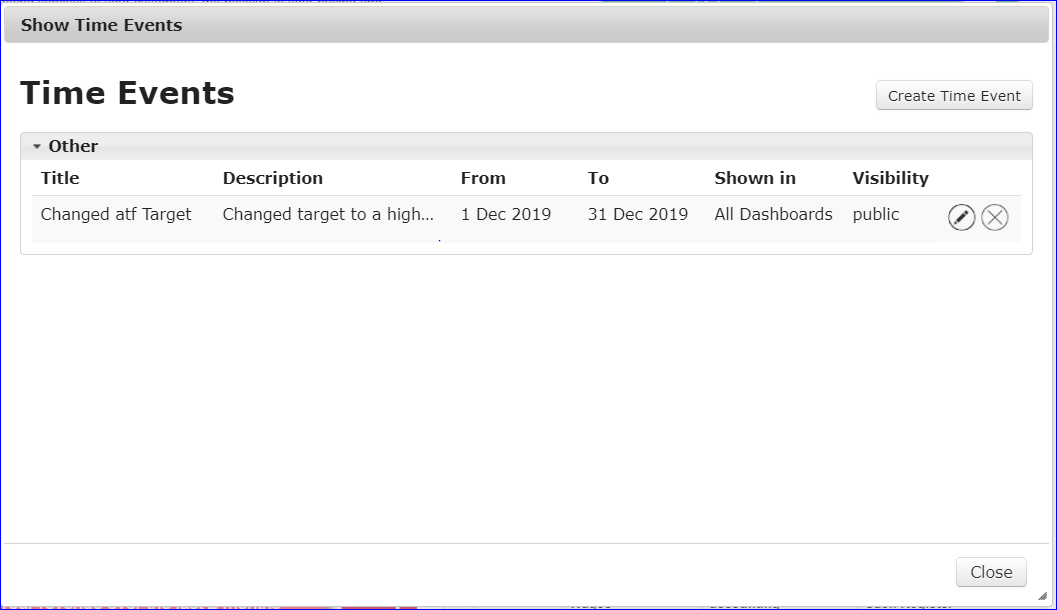
You can edit or delete the time event in the above window.
...