/
Configure a Report on a Dashboard
Configure a Report on a Dashboard
- Joss Herrmann
- Deborah Pender (Unlicensed)
Owned by Joss Herrmann
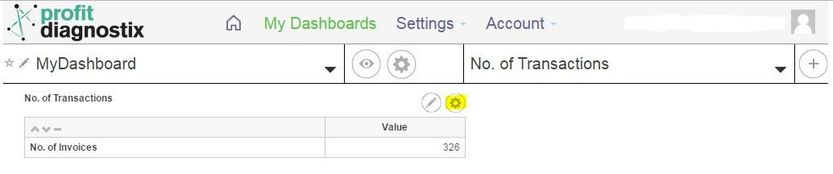
Click on "Settings" to change the output configuration of the report for this dashboard.
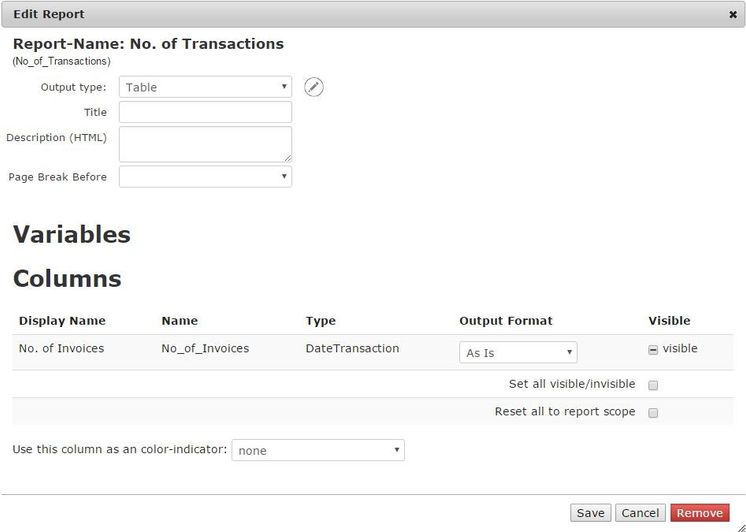
The "Edit Report" popup gives access to various configuration options of the representation of the report on the current dashboard. It's possible to add the report twice (or more) in different representations like table and chart view.
Options:
- Output type: Depending on the report type different output types can be selected. Each can have it's own configuration, accessible by clicking the pencil button on the right.
On all output types the row and column names can be overriden. On the "Angula Gauge" there are additional options to set. - Title: Overrides the report title shown on top of the report and can include HTML code. It's also possible to display the value of a variable (dashboard scope) for example to show the date range that is used for the current result. The variable name has to be in "[]".
Please note that if a report variable is overridden with a global variable, the name in the title has to be the name of the global variable.
Example: "Number of Invoices</br>[period]"
Please add HTML-Code carefully as it can easily break the layout of the dashboard. - Description: Adds a tooltip left of the title. This can also contains HTML including IMG-Tags and links. Please add HTML-Code carefully as it can easily break the layout of the dashboard.
- Variables:
- On a newly added report all variables are on report scope. Selecting a report variable gives you the possibility to override the it with a global variable. Simply select the global variable from the dropdown.
This can be usefull if a dashboard should have one global variable for the period for all the report on this dashboard. This is used by the "Business Performance" dashboards, for example.
- On a newly added report all variables are on report scope. Selecting a report variable gives you the possibility to override the it with a global variable. Simply select the global variable from the dropdown.
- Columns:
- Output Format: Each column/result can be formatted as Integer, Float or Currency via the "Output Format" dropdown
- Visibility: By default, the visibility of a column/result is the visibility configured in the report (indicated by '-' and the state on the right)). It can be overridden by changing the checkbox to "empty" or "checked"
- Color-Indicator: The chosen column/result changes the color of the result. Negative: red, positive and zero: green. To invert the color a invisible dummy row with the formula "-$row" can be added to the report and chosen as color indicator row.
Press "Save" to save the changes. The changes should be visible instantly.
Press "Remove" to delete a report from the dashboard
, multiple selections available,