...
This report looks at spending behaviour in you business and is an INDICATOR of customer loyalty.
Listed will be the names of your loyal clients Amount spent, Invoice count and contact details.
Your report states you can change the average industry value variable.
A detailed instruction is as follows.
Main dashboard → Settings → Variables → Avg
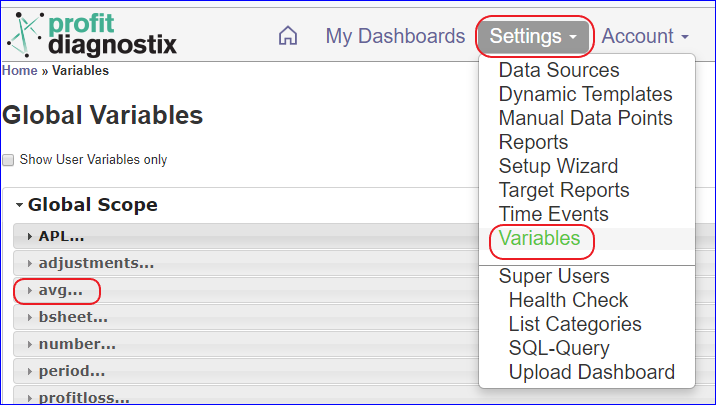
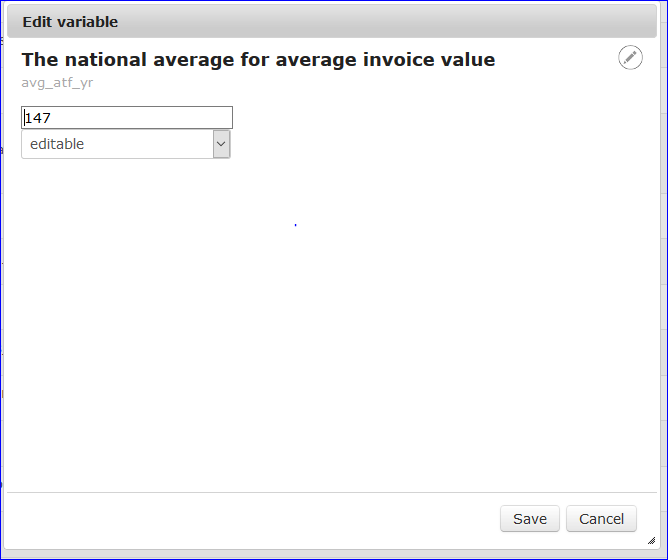
Next on the variable click the edit pencil


Change to the figure you wish to use then save.

PRINTING → Use the share button → PDF or HTML
Share as PDF
Share as HtmlFor a further information please contact support@profitdiagnostix.com
Related Articles
| Filter by label (Content by label) | ||
|---|---|---|
|
[remember to add more labels]
...