Dashboard Source Row Type
The included reports have to be of the same type, e.g. same grouping, as the column names are matched by there names.
The column name, visibility and the order of the reports can be adjusted by configuring the reports on the "Dashboard Source" row in the same way like on a normal dashboard as well as overriding variables, titles and descriptions.
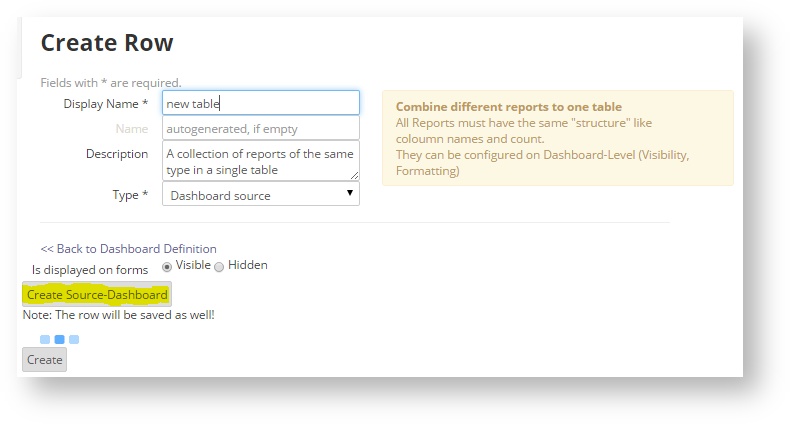
Create a Dashboard source row
To create a Dashboard source row, fill in the the name field and press "Create Source-Dashboard".
UPDATE PHOTO WHEN DASHBOARD REPORT IS WORKING
Adding reports to the source dashboard
A source dashboard is a special type of the normal dashboards but only with a single row.
To add a new report, select the report (dropdown) and press the '+' button, similar to a normal dashboard.
The possibilities to configure the reports are exactly the same like on a normal dashboards so please refer to the section "Configure a Report on a Dashboard".
As it's not possible to combine graphical output types, the output types are restricted to "Table" and "Pivot Table".
The report name is used as the first table row while the column names are the table header (or the other way around when pivoted.
The different reports are matched by column names, so the results have to be the same column names. Otherwise a new column will be added to the table.
Examples:
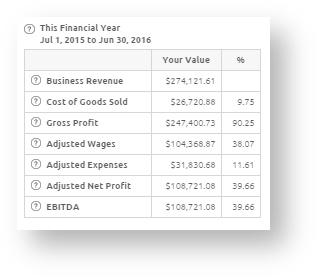
Source Dashboard:

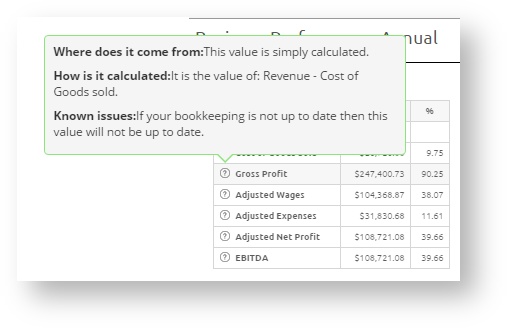
Dashboard Report (Report name and description becomes row name and description)