Your Dashboard Functions
How to drill down further into the data displayed in your report.
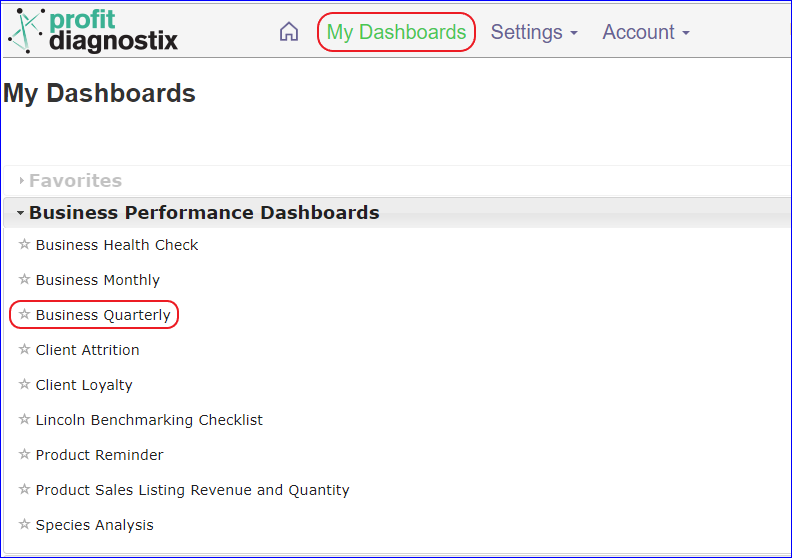
Navigation: Go to main menu → My Dashboards → Business Quarterly
Click on an image to enlarge
Using the dashboard functions of the Business Quarterly
This report runs for 2 years. Each column is a financial quarter (3 months)
When you hover over the data figures in the tables you get the opportunity to drill down further and see the POS or Accounting data that is being measured.
The displayed graphs are interactive. Hover over lines in the graphs and a small information display will pop up.
PRINTING → Use the share button → PDF or HTML
Share as PDF
Share as HtmlFor a further information please contact support@profitdiagnostix.com
Related Articles
-
-
Product Sales Listing Revenue and Quantity (ProfitDiagnostix Public knowledge base)
-
-
-
-
-