By Product Reports
Possible row types:
- Invoice: Collects data from the invoice table
- Invoice Line: Collects data from the invoice lines table
- Formula: Use existing report variables or row results to calculate a value
- /wiki/spaces/SVA/pages/10420360: Use a predefined SQL query (see Settings > SQL Query). These SQL queries can only be defined/edited by admins (for security reasons)
- Alias Normalisation Factor: (currently not in use)
A By Product Report is a great way to see the exact amount of products you have sold in a certain time period. You can also refine this report so you aren't seeing every single product sold, instead you can choose just consultations, just dentals or just x-ray products.
Start by going to Settings >> Reports >> Create Report on LHS.
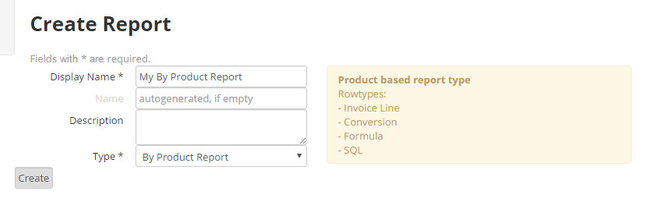
Example of report:
Display Name: By Product Report - or more specifically tailored to the type of products/date range you want to look at.
Type: By Product Report
Click on Create.
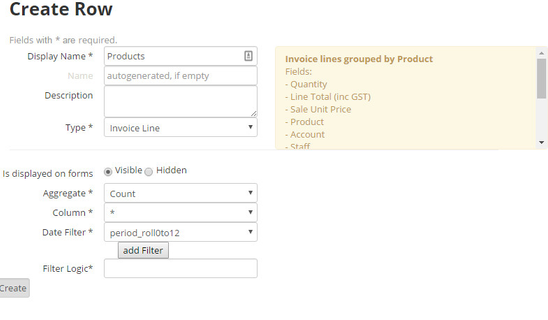
Now we need to make a row of the products. Do this by clicking on the "Add Row" link.
Display Name: e.g. Products
Type: Invoice Line (products are counted on an invoice line therefore you need to choose this type)
Date Filter: e.g. 12 month period is period_roll0to12
Click on Create.
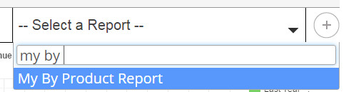
Add this to the dashboard by going to your dashboard, clicking on the pen symbol, search for your report (in this case it's called "My By Product Report") then click the plus ![]() button.
button.
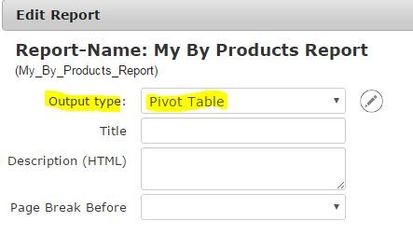
You can leave it as it is, or on the dashboard you may want to pivot the table to view it more clearly. Click on Settings on the top right hand corner for that report >> Output Type >> Pivot Table >> Save
If you want to see the amount of money these products are generating, you can edit this report. Click on the 'Edit' link for that specific report which will take you back to the editing feature.
Click on 'Add Row'. Here, add the name for example: Price.
The type will be Invoice Line.
Aggregate: will be Sum as there will be multiple amounts. The Sum function adds up the dollar value of each time you sold a specific product. eg. dog food for $10 sold 5 times will give a result of 5 for Count and 5X$10=$50 for price.
Column: will be Line Total (inc GST) - this means we are adding the Line Total for the invoice line
Date Filter: needs to be the same as the previous row: Period_roll0to12
Then click on Create.
Go back to your dashboard to view this change, it will look like this but longer:
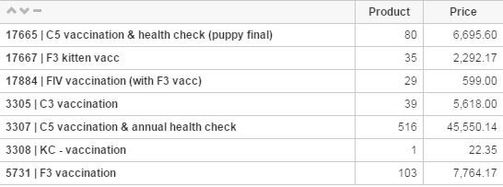
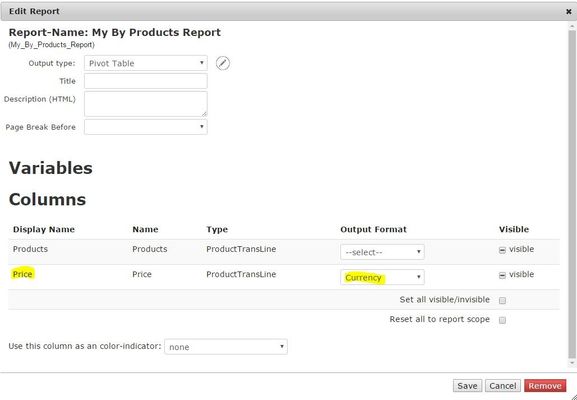
If you want to see the price column as a dollar value, click on Settings on the top right hand corner for that report. Go to Output Format (Make sure only to edit the Price row). Change to Currency.
Then click on Save.
If you are looking to pinpoint specific products you can edit this report. Click on the Edit link on the top right hand corner for that report.
An example of reducing the amount of products in your table is done by creating filters within the row. Each row should have the same filter. So if you have a price row and a Quantity row, both should have the same filter.
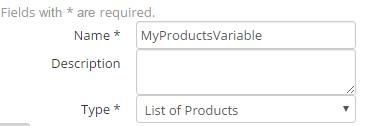
Create a variable by clicking on 'Add Report Variable' at the middle of your page.
Name: e.g. MyProductsVariable (No spaces in variable names)
Type: List of Products
Click on Create.
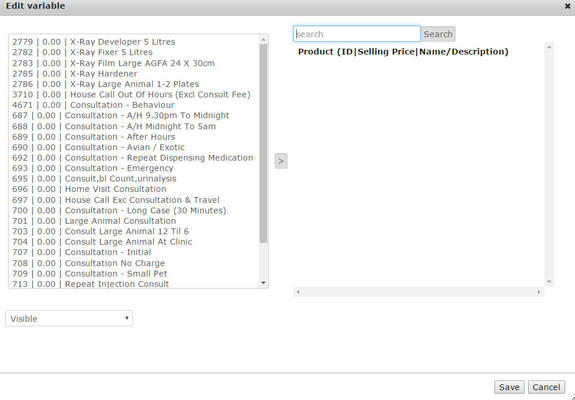
Edit the variable to add the specific products you want to view. Do this by clicking on the edit tool where the variable is shown:

For example, type 'consult' in the search bar and click on all of the consults or certain consult products you want to view. You can also add more products to view in your report. After adding your desired products by clicking on them, your screen will look like this:
Now go into the Products row by clicking on the edit tool for that row.
Add the first filter that will eliminate any products that have not been sold in this specific date range that will appear on the report as zero.
This is done by putting 'Quantity' in the first drop down menu, 'greater than' in the second drop down menu and 'number zero' in the third drop down menu.

The next step is to add the variable. Do this by adding another filter.
The first drop down menu will be 'Product', the second drop down menu will be 'inc' and the third drop down menu will be the variable you just created 'MyProductsVariable'.

Click on Save when this is done.
On the dashboard, the report will now show the customized report with the products you chose to show:
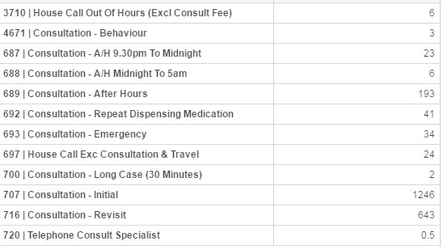
Note that if all of the products that you chose are not showing on your report it means that none of these products were sold in the time period you chose.
If you want to show these products with 0 on the report, delete the first filter 'Quantity greater than number zero'.