HTML Info Component Reports
- Joss Herrmann
- Bill Eastgate (Unlicensed)
- Emma Pearce (Unlicensed)
- Deborah Pender (Unlicensed)
HTML Info Component Reports are only able to display static HTML content but no database results or calculations. They are used to add additional information about a dashboard and its contents.
Therefore it has only data rows that contain the HTML code.
Possible row types:
There are merely text based reports that do not include any graphs, tables or figures of any kind. These reports can be used to discuss or expand a report and can have them position next to each other on your dashboard.
You may want to use it as an introductory paragraph to the reports that follow, e.g. "This report shows a snapshot of the business and will show any areas that may be affecting the business. The reports that follow are:..."
To do this, go to Settings at the top of the page and click on the Reports tab. Click on Create Report on the LHS.
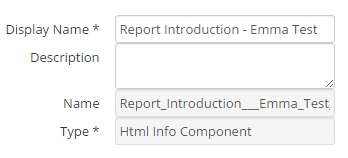
Display Name: e.g. Report Introduction
Type: HTML Info Component
Click on Create.
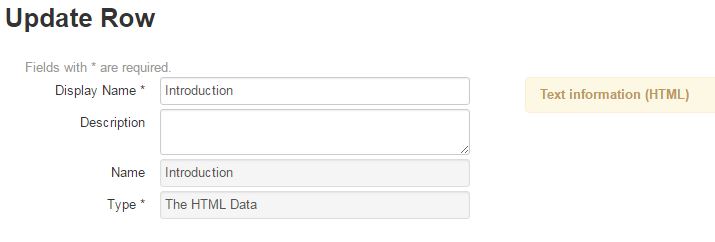
To input the text you want for this report, click on Add Row.
Display Name: e.g. Introduction
Type: The HTML Data
Click on create.
Go back into the row to add the text by clicking on the edit tool.

Once the box appears, type your required text. You can change the font, text size, colour, alignment on page etc.
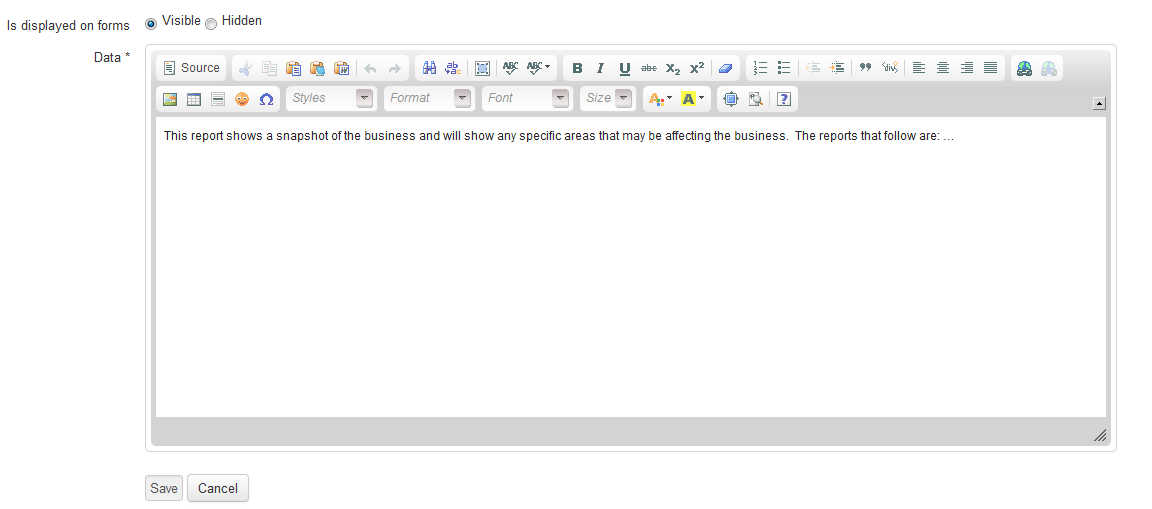
When you are finished, click on Save.
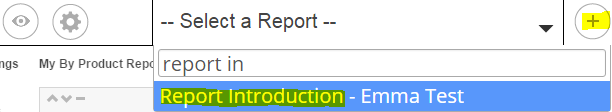
All you need to do now is add it to your dashboard. Do this by going to your dashboard, click on the pen tool, search for your report name e.g. "Report Introduction". Once your report appears, click on the plus ![]() symbol.
symbol.
Here is how it is shown on your dashboard:
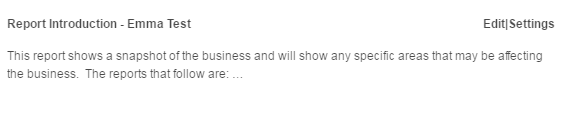
You can move this to sit above all of you reports, underneath, next to or just as a general informational paragraph.
Remember to refresh the report to update the display - caching will hide it.