Transaction Reports
- Joss Herrmann
- Emma Pearce (Unlicensed)
Possible row types:
- Invoice: Collects data from the invoices table
- Invoice Line: Collects data from the invoice lines table
- Profit and Loss: Collects data from the ledger accounts imported from the bookkeeping software
- KPI: Collects data from "Manual Data Points" (time based static values) (see Settings > Manual Data Points)
- Formula: Use existing report variables or row results to calculate a value
- /wiki/spaces/SVA/pages/10420360: Use a predefined SQL query (see Settings > SQL Query). These SQL queries can only be defined/edited by admins (for security reasons)
- Alias Normalisation Factor: (currently not in use)
A transaction report can also be used to view multiple products in a report. Rather than seeing all products then creating a variable to reduce the amount of products showing in the By Product Report, you can create rows that are specific to the products you want to see.
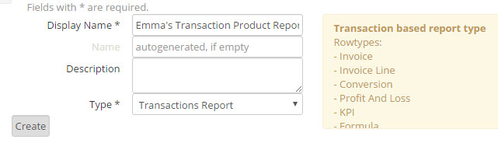
Start by going to Settings >> Reports >> Create Report on LHS.
Display Name: e.g. Transaction Product Report
Type: Transactions Report
Click on Create.
Start by adding a row with the first product you want to see on your report
Display Name: e.g. Dentals
Type: Invoice Line
Aggregate: Count (you want to count the amount of dental products sold)
Column: * (doesn't need to change)
Date Filter: e.g. the last month - period_vet_sp_mon_past
Add filter to specify the dentals: Menu 1 is Product. Menu 2 is Inc. Menu 3 is transactional_dentistry.
Click on Create when done.
![]()
Continue to do this for more rows if you want to see more products sold in these specific date ranges.
E.g. Cytology, Hospitalisation fees etc.
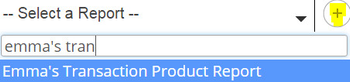
When you've finished adding products, add the report to the dashboard.
Do this by going to your dashboard, clicking on the pen tool then typing int the name of your report in the search bar then click on the plus button.
This is how it looks on your dashboard.
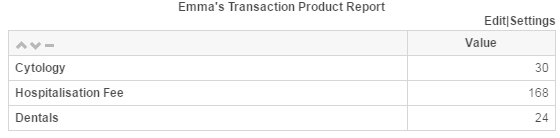
It is different to a By Product Report as it doesn't show each separate product, instead it groups them together to show a total amount of products sold in that group for a given time period.